Summary Statistics Tables
Before you begin, set up a do file that downloads data from the paper Price Subsidies, Diagnostic Tests, and Targeting of Malaria Treatment: Evidence from a Randomized Controlled Trial by following the instructions here.
The data set contains seven baseline variables, each of which begins with the prefix b_*. This page explains
how to make two types of summary statistics tables: one that summarizes the characteristics of the baseline variables (means,
standard deviations, etc.) and another that checks for covariate balance in the treatment and control groups.
Before you begin, familiarize yourself with the baseline covariates included in the data set. Label them
with short, self-explanatory labels using the label var command.
Storing Summary Statistics with estpost
The command
summarize b_*
will produce summary statistics on all the variables beginning with b_. Immediately after you run
the summarize command, your results are saved in a collection of local macros and matrices. You can see
what is saved by typing
return list
immediately after your summarize command (or any other command that calculates statistics from data). These locals
are only stored temporarily; they are over-written as soon as you use another command. So, you need to save your results somewhere.
Adding the Stata command
estpost before summarize will save your results as matrices. Importantly, this allows you to save
the summary statistics for multiple variables in a single step. Specifically, the command
estpost summarize b_*
will generate matrices that contain the means, standard deviations, minima, and maxima for all
the variables beginning with b_*. So, for example, e(mean)' contains the means of all of the variables
beginning with b_* `, which you can
view using the command
matrix list e(mean)
The estpost command will also save matrices e(sd), e(Var), e(min), e(max), and e(count). You can also
use the estpost command with summarize and ttest to save different collections of summary statistics. More information
is available in Stata’s estpost help file.
Making a Table Using esttab
Now that you’ve stored your summary statistics using estpost, you can make a table using Stata’s
esttab command - the same esttab command that you use to make a table of regression
results. Using esttab to make a
summary stats table is a bit of a hack: Stata is looking for regression results saved as
e-class matrices (which come from regression estimation), but we’ve used the estpost command
to save our summary statistics in that format. This allows us to use esttab to make
a polished table that can be exported to word, excel, or latex.
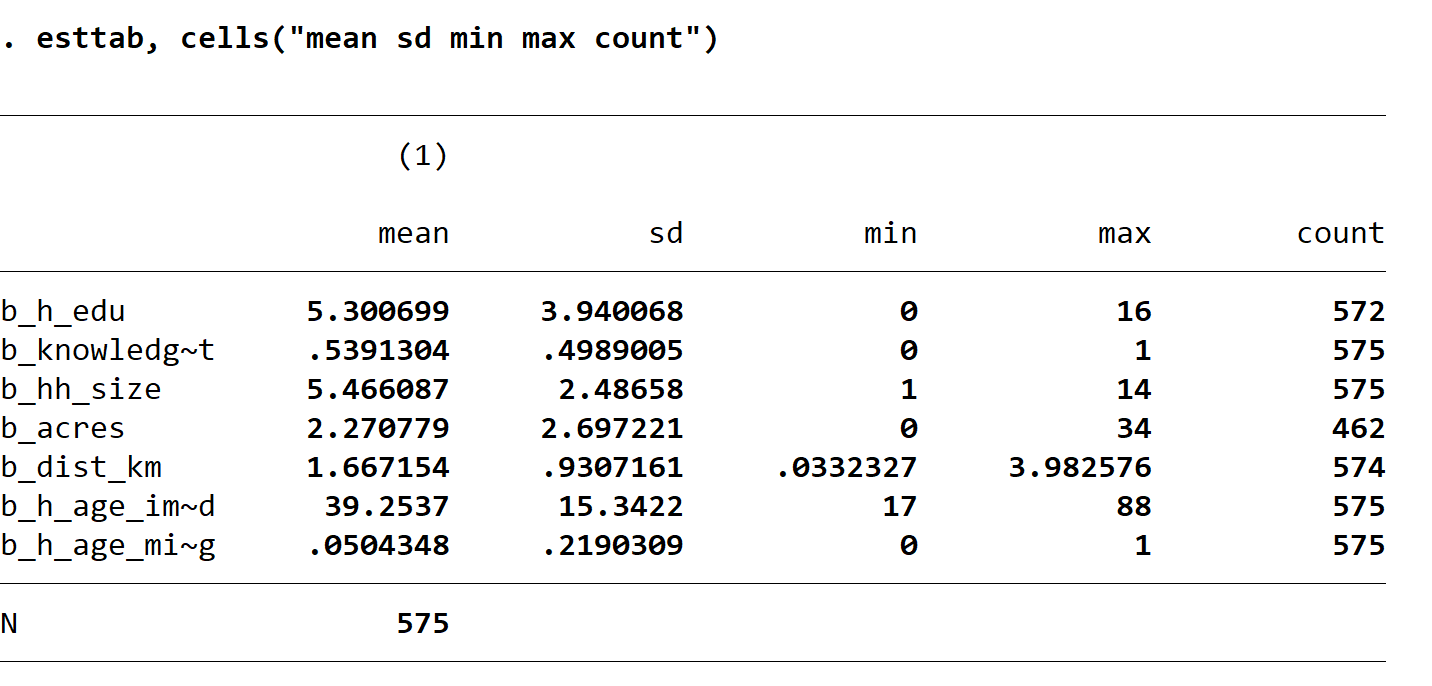
You can use the command
esttab, cells("mean sd min max count")
to create a simple table of summary statistics (like the example below) in Stata’s output window.
This table already lookes pretty good, but we can make it look more professional by using
some of esttab’s options. The noobs options will remove the bottom panel listing the sample size,
since it is redundant. The nonum option will remove the number (1) from the table header. Adding
nomtitle collabels("Mean" "S.D." "Min." "Max." "N")
will replace the default column headings (reflecting the names of the e-class matrices included in the table)
with column headings of our choice. Finally, we can modify the content of the cells() option
to format each of the columns as we wish by replacing
cells("mean sd min max count")
with
cells("mean(fmt(%9.2f)) sd min max count(fmt(%9.0g))")
This will limit the number of decimal places to two for the first four columns while reporting whole numbers in the final column.
To export your finished table to word, you can add using followed by the name of a rtf (rich text format)
file immediately after esttab. So, for instance, the code
esttab using summ-stats-example1.rtf, replace ///
cells("mean(fmt(2)) sd min max count(fmt(%9.0g))") ///
label noobs nonum nomtitle ///
collabels("Mean" "S.D." "Min." "Max." "N") ///
title(Summary Statistics Table)
would save a file summ-stats-example1.rtf in your working directory which could then be opened with word. esttab
can also export tables in latex, html, or markdown format, or as csv files that can be opened in excel.
A Balance Check Table
It is often helpful to produce a table that compares the means of variables across two or more groups: for example,
to check whether randomly assigning treatment has produced groups that look similar in terms of pre-treatment covariates,
or to compare outcomes for men and women. We can do this by combining the eststo, estpost, and esttab commands.
As you may recall, Stata’s eststo command saves regression results. For example, we can use the command
eststo reg1: reg y x1 x2
to save the results of a regression of y on x1 and x2. As we discussed above, the estpost command makes the summary statistics
produced by commands like summarize, ttest, and tabulate look like regression results to Stata. When you combine eststo and
estpost, you can save named collections of summary statistics. You can then combine multiple collections of summary statistics
in a single table using esttab, as you would combine the results of different regression specifications.
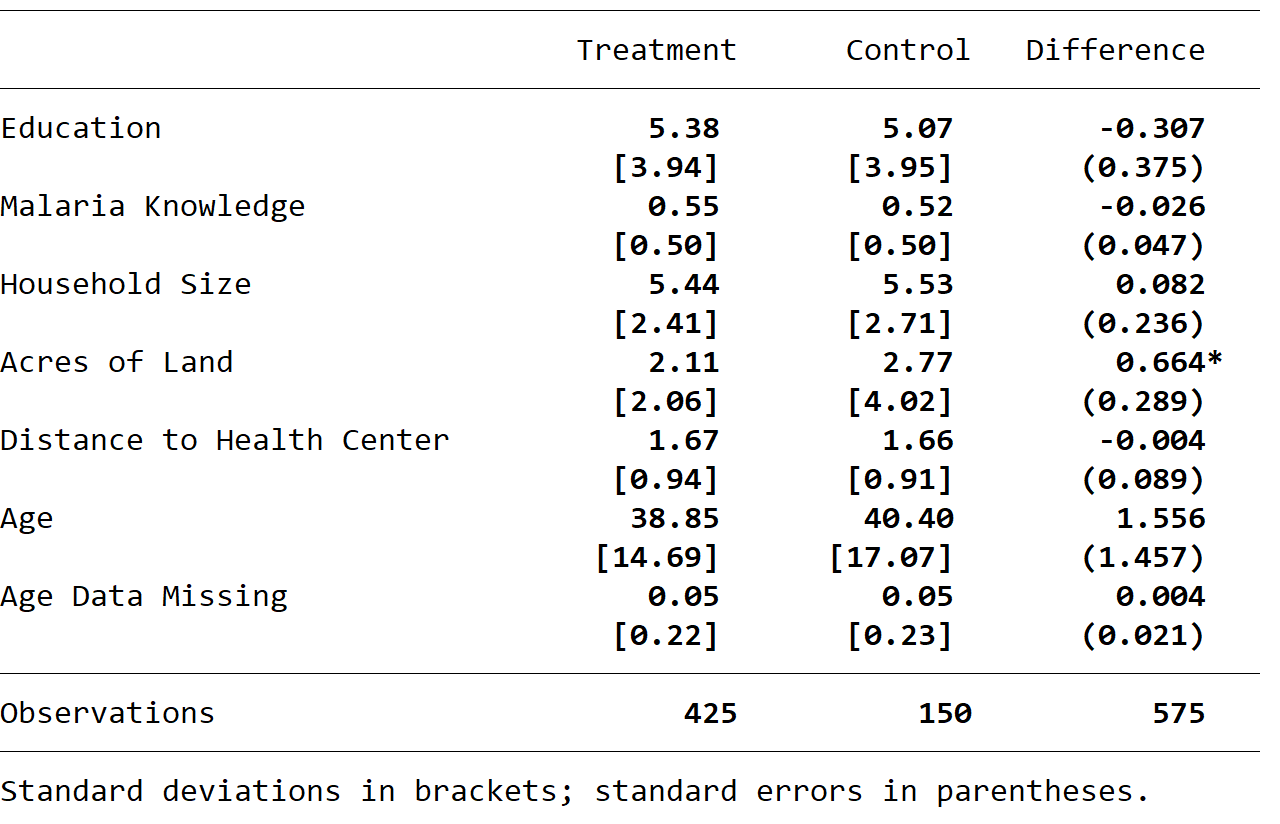
The sample code below generates a balance check table that reports means and standard deviations of baseline covariates for the randomly assigned treatment groups (in Cohen, Dupas, and Schaner’s RCT), and then tests the null hypothesis that the means of these variables are similar in the treatment and comparison groups.
eststo clear
eststo treatment:  estpost summarize b_* if act_any==1
eststo control:  estpost summarize b_* if act_any==0
eststo diff:  estpost ttest b_*, by(act_any)

esttab treatment control diff using balance-table.rtf, ///
	replace label varwidth(28) ///
	cell(mean(pattern(1 1 0) fmt(2)) & b(pattern(0 0 1) star fmt(3)) ///
	sd(pattern(1 1 0) par([ ]) fmt(2)) & se(pattern(0 0 1) par fmt(3))) ///
	collabels(none) mtitles("Treatment" "Control" "Difference") nonum ///
	note(Standard deviations in brackets; standard errors in parentheses.)
The code generates the output below:
A do File
A do file containing the code used in these examples is available here.