A Regression Table
The stata commands eststo and esttab allow you to make attractive,
self-contained tables with very little effort. Before you begin, set up a do file that
downloads data from the paper
Price Subsidies, Diagnostic Tests, and Targeting of Malaria Treatment: Evidence from a Randomized Controlled Trial by following the instructions here.
Storing Regression Results with eststo
eststo is a Stata command that allows you to save the results of a regression. Immediately after you run
any regression, your results are saved in a collection of local macros and matrices (you can see what is saved
by typing ereturn list immediately after running your regression). These locals are
over-written as soon as you run another regression - so we need to save them somewhere. That is what eststo does.
eststo is very easy to use. You can simply type eststo after running any regression. Alternatively, you can precede
each regression command with eststo:, as you see in this example:
eststo: reg c_act coartemprice
By default, eststo saves the results from your first regression as est1, the results from your second regression
as est2, etc. But you can provide alternative names if you prefer: just type eststo followed by your preferred name
for a particular specification (either after running the regression or before the colon in a single line of code).
To see which regression results are currently stored in memory, type eststo dir. The erase them and start fresh,
type eststo clear. It is worth taking a look at the help file for eststo to familiarize yourself with its syntax before proceeding.
Exporting Regression Results to Word
Suppose you run the following regressions and you want to export your results as a regression table:
eststo clear
eststo:  reg c_act coartemprice
eststo:  reg c_act coartemprice b_*
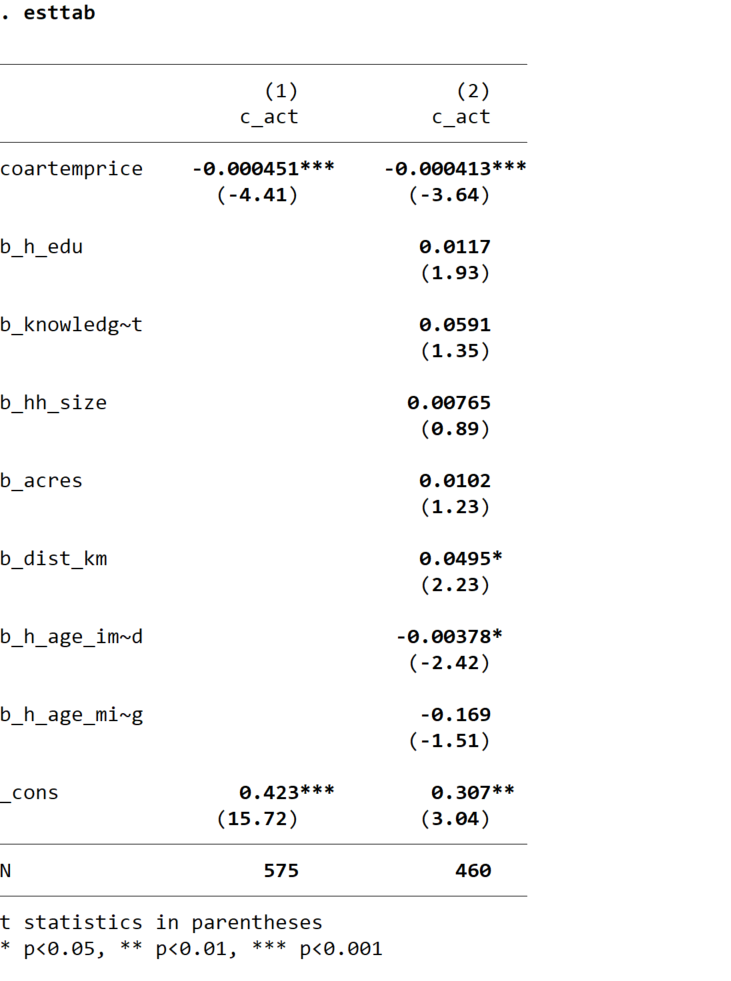
Simply typing esttab after storing the results of these regressions will produce a decent-looking regression table
in Stata’s output window:
If you want to export this table to a word document, you can use the command
esttab using myregtable.rtf, replace
which will save a rich text format (rtf) file in your working directory, which you can then open using word.
Publication-Ready Tables
You can clean up your table by labeling your variables using the label var command (note: you must
do this before you run your regressions). When variable names appear in otherwise finished tables,
readers often have a hard time knowing what the variables are: names like b_dist_km
or txpostxfem may not be immediately self-eplanatory. And they do not look very professional. If
your variables are labeled, you can invoke esttab’s label option to use labels rather than variable names.
Variable labels should be short, so that they do not wrap over multiple lines in your table. They should also be self-expanatory. You can include additional information in the table notes when necessary.
If you have categorical variables that can be replaced with easier-to-interpret dummy variables, this might be a good
opportunity to transform them. So, for example, you can include a rural dummy labeled “Rural” instead of
a region variable labeled “Region of residence: urban = 1, rural = 2”. This will make it easier for
readers to immediately interpret your regression coefficients.
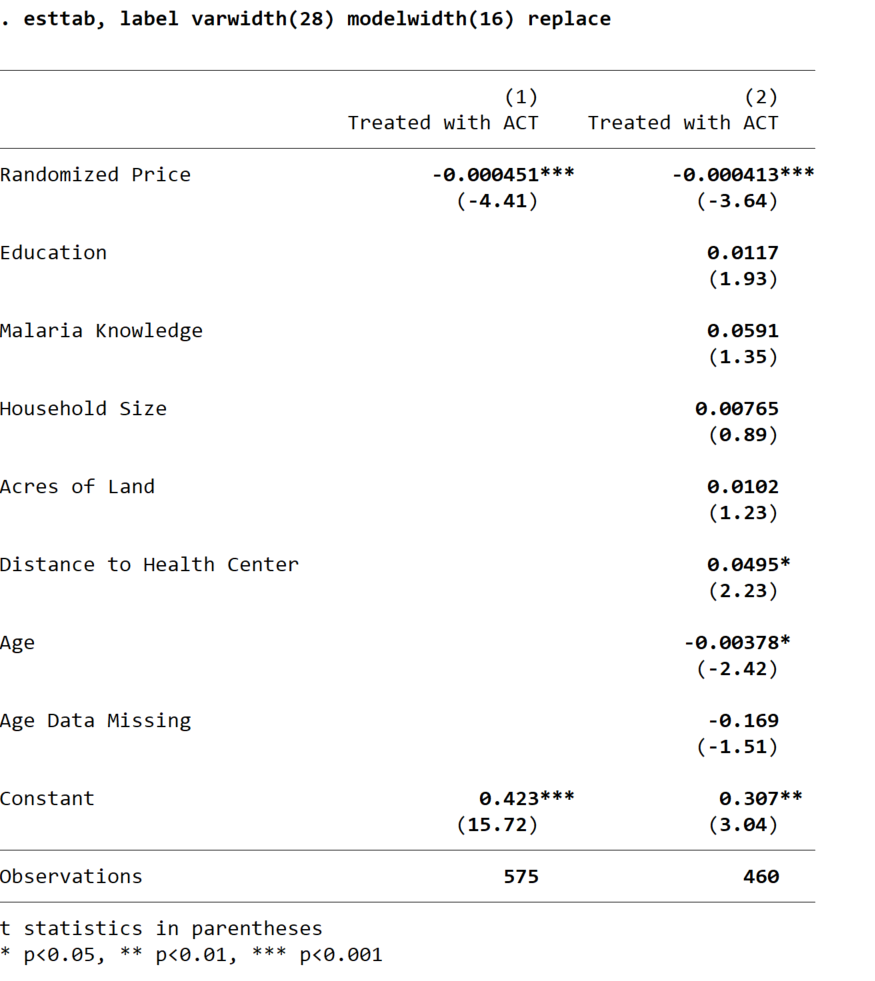
Having relabeled the data, you can use esttab to generate a new version of your regression table. If the text of
your variable labels wraps onto a second line, you can make the first column of the table wider using esttab’s
varwidth() option. In the example below, I used varwidth(28) You can also set the width of your columns of coefficient estimates
using the modelwidth() option. I used modelwidth(16). It’s not clear what the units are,
but higher numbers lead to wider columns. This gives you a fairly professional looking table:
Before publishing this table, you’d want to find out why your two regression specifications include different numbers of observations. Otherwise, you won’t know whether any difference in the coefficient of interest between Column 1 and Column 2 results from adding the controls or changing your analysis sample. You should always make sure that the columns in your regression tables contain identical numbers of observations (unless you are varying the sample intentionally, for example if you were looking at treatment effects on women in one column and treatment effects on men in another column).
You might also notice that the coefficient estimates associated with with coartemprice variable are very long - the begin
with three zeroes after the decimal point. To correct this, simply divide the coartemprice variable by 100 (or even 1000) before
running your regressions. This will not alter any of your other coefficients, but it will rescale the coefficients on price
so that they fit into the table more easily. (Of course, this changes the interpretation slightly: the coefficient
would then indicate the change in your outcome variable resulting from a 100 shilling increase in the price of coartem
rather than a one shilling price increase.)
Additional esttab Options
Economists typically report standard errors rather than t-statistics in parentheses. You can
achieve this by invoking esttab’s se option. If you want to specify how many digits
to report, you can do this adding a number in partheses after either b (for the coefficient
estimates) or se (for the standard errors). So, if for some reason you wished to report
coefficient estimates to two decimal places and standard errors to three, you would use
the command
esttab, b(2) se(3)
You can change the headings of the columns reporting regression coefficients with esttab’s
mtitles() option. By default, columns of coefficients will be numbered, and either the name
of the dependent variable or its label will appear as well. However, when the outcome variable does not
differ across columns, it often makes more sense to use more informative columns headings. For example,
if your first specification was OLS and your second specification was probit, you might want to label
your columns accordingly:
esttab, mtitles(OLS Probit)
If you wish to use multi-word column headings, you can put each one in quotes. For example:
esttab, mtitles("Rural Areas" "Urban Areas")
You may not always want to report the coefficients on your control variables - particularly when
your specification includes a large number of fixed effects. The esttab option keep() allows
you to provide a list (in parentheses) of the variables that you want to appear in your table. Alternatively,
you can use the option drop() to indicate which variables should be surpressed. The option
indicate() drops a specific set of variables from the table (like drop()) but also creates an additional
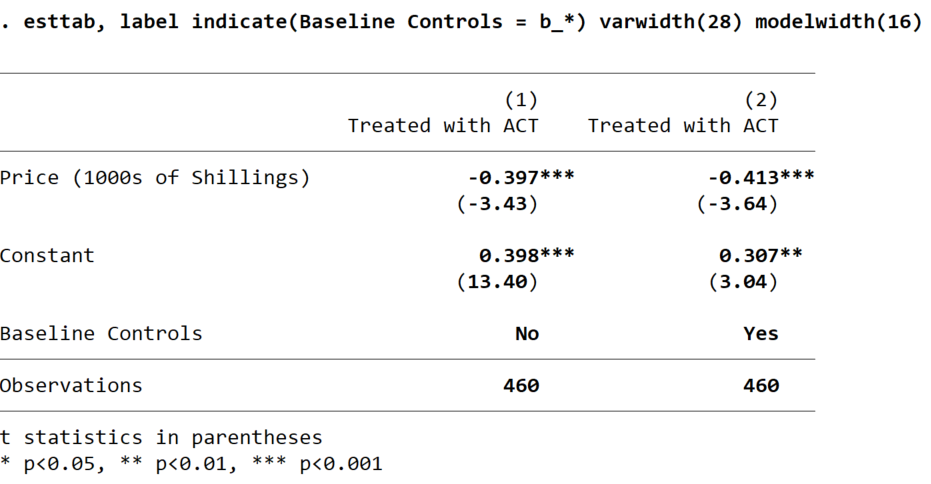
row at the bottom of the table indicating which specifications include the dropped variables. For example:
eststo clear
eststo:  reg c_act coartemprice
eststo:  reg c_act coartemprice b_*
esttab, label indicate(Baseline Controls = b_*) replace
produces the table below.
You can also use the note() option to add any relevant information in the table notes. You will
typically want to indicate what specification you are using (i.e. OLS or logit), what level you are
clustering you standard errors at (or, if you are not clustering, that they are robust), and
which controls are included in which specifications, if that is not obvious from the body of your table.
Exporting Regression Results to LaTeX or Excel
The esttab command can also be used to export regression results to
Excel or LaTeX. To export to Excel, just name your new file as a csv file rather
than an rtf file:
esttab using myregtable.csv, replace
A nice thing about exporting to Excel is that you can make additional modifications
(for example, to format borders) using the putexcel command.
esttab can also export your table to LaTeX - all you need to do
is give your new file a name that ends in tex. For example,
if you export your regression results using the code
esttab using myregtable.tex, label b(2) se(2) nostar replace ///
   title(Regression table\label{tab1})
you can compile a pdf of the table in overleaf or any other LaTeX compiler with the LaTeX code:
\documentclass[12pt]{article}
\begin{document}
\input{myregtable.tex}
\end{document}
A do File
A do file containing the code used in these examples is available here.