3 Data Visualization
Readings
These are useful references as opposed to required readings.
Fundamentals of Data Visualization
A Very Old Development Impact Blog Post Where David McKenzie Talks About Graphing Treatment Effects
Lecture
Optional Lab
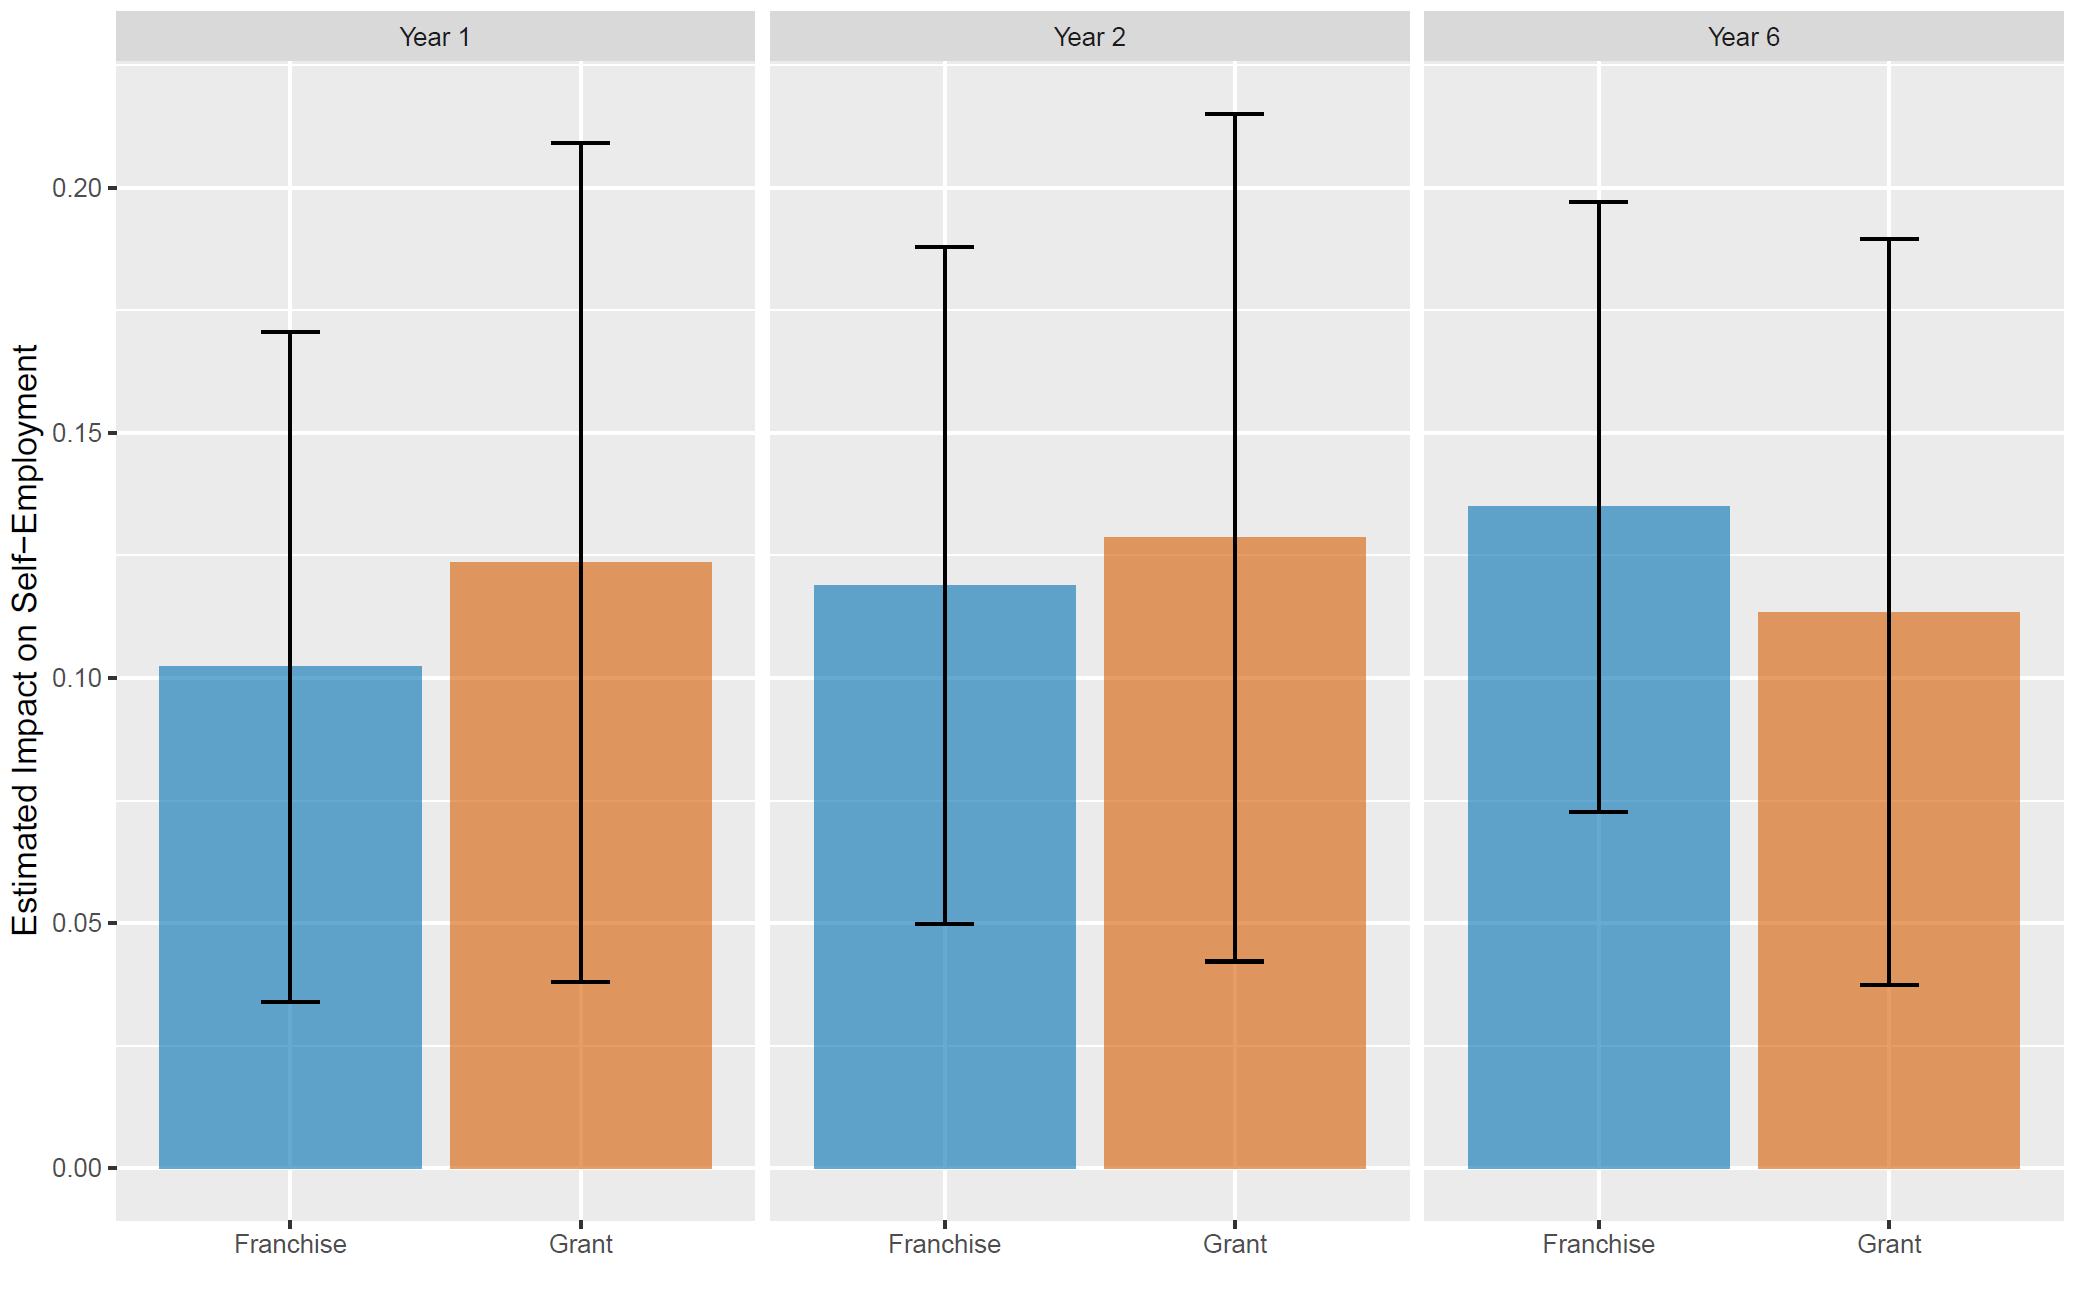
Objective: for this lab, you will be using the replication files from my paper A Firm of One’s Own: Experimental Evidence On Credit Constraints and Occupational Choice. The paper describes the results of a randomized trial evaluating the impact of a program intended to help young women in Nairobi become small-scale entrepreneurs. You can read a short article summarizing our study here. In this lab, you’ll be making a figure summarizing the treatment effects of the two intervention arms in the study on rates of self-employment. Details are contained in the R/Python code template ECON370-lab3.txt.
As part of the lab, you will be asked to replicate the following graph: