2 Exploratory Data Analysis
Readings
These are useful references as opposed to required readings.
Fundamentalso fo Data Visualization: 7, 12.1
An Intro to Statistical Learning: 7.6
Lecture
Lab
Objective: conduct exploratory data analysis of transaction-level data from Provisions Williamstown. After loading and cleaning the transactions data, you will create a summary statistics table, a histogram of transaction amounts, a histogram of daily/weekly/monthly sales or revenues, and a scatter plot. Details are contained in the R/Python code template ECON370-lab2.txt.
You will upload a finished summary statistics table that is either a pdf produced using latex or an html file. A latex template is available here, and an html template is available here. You can compile the latex template using overleaf or your favorite latex editor.
As part of the lab, you will be asked to replicate the following graph:
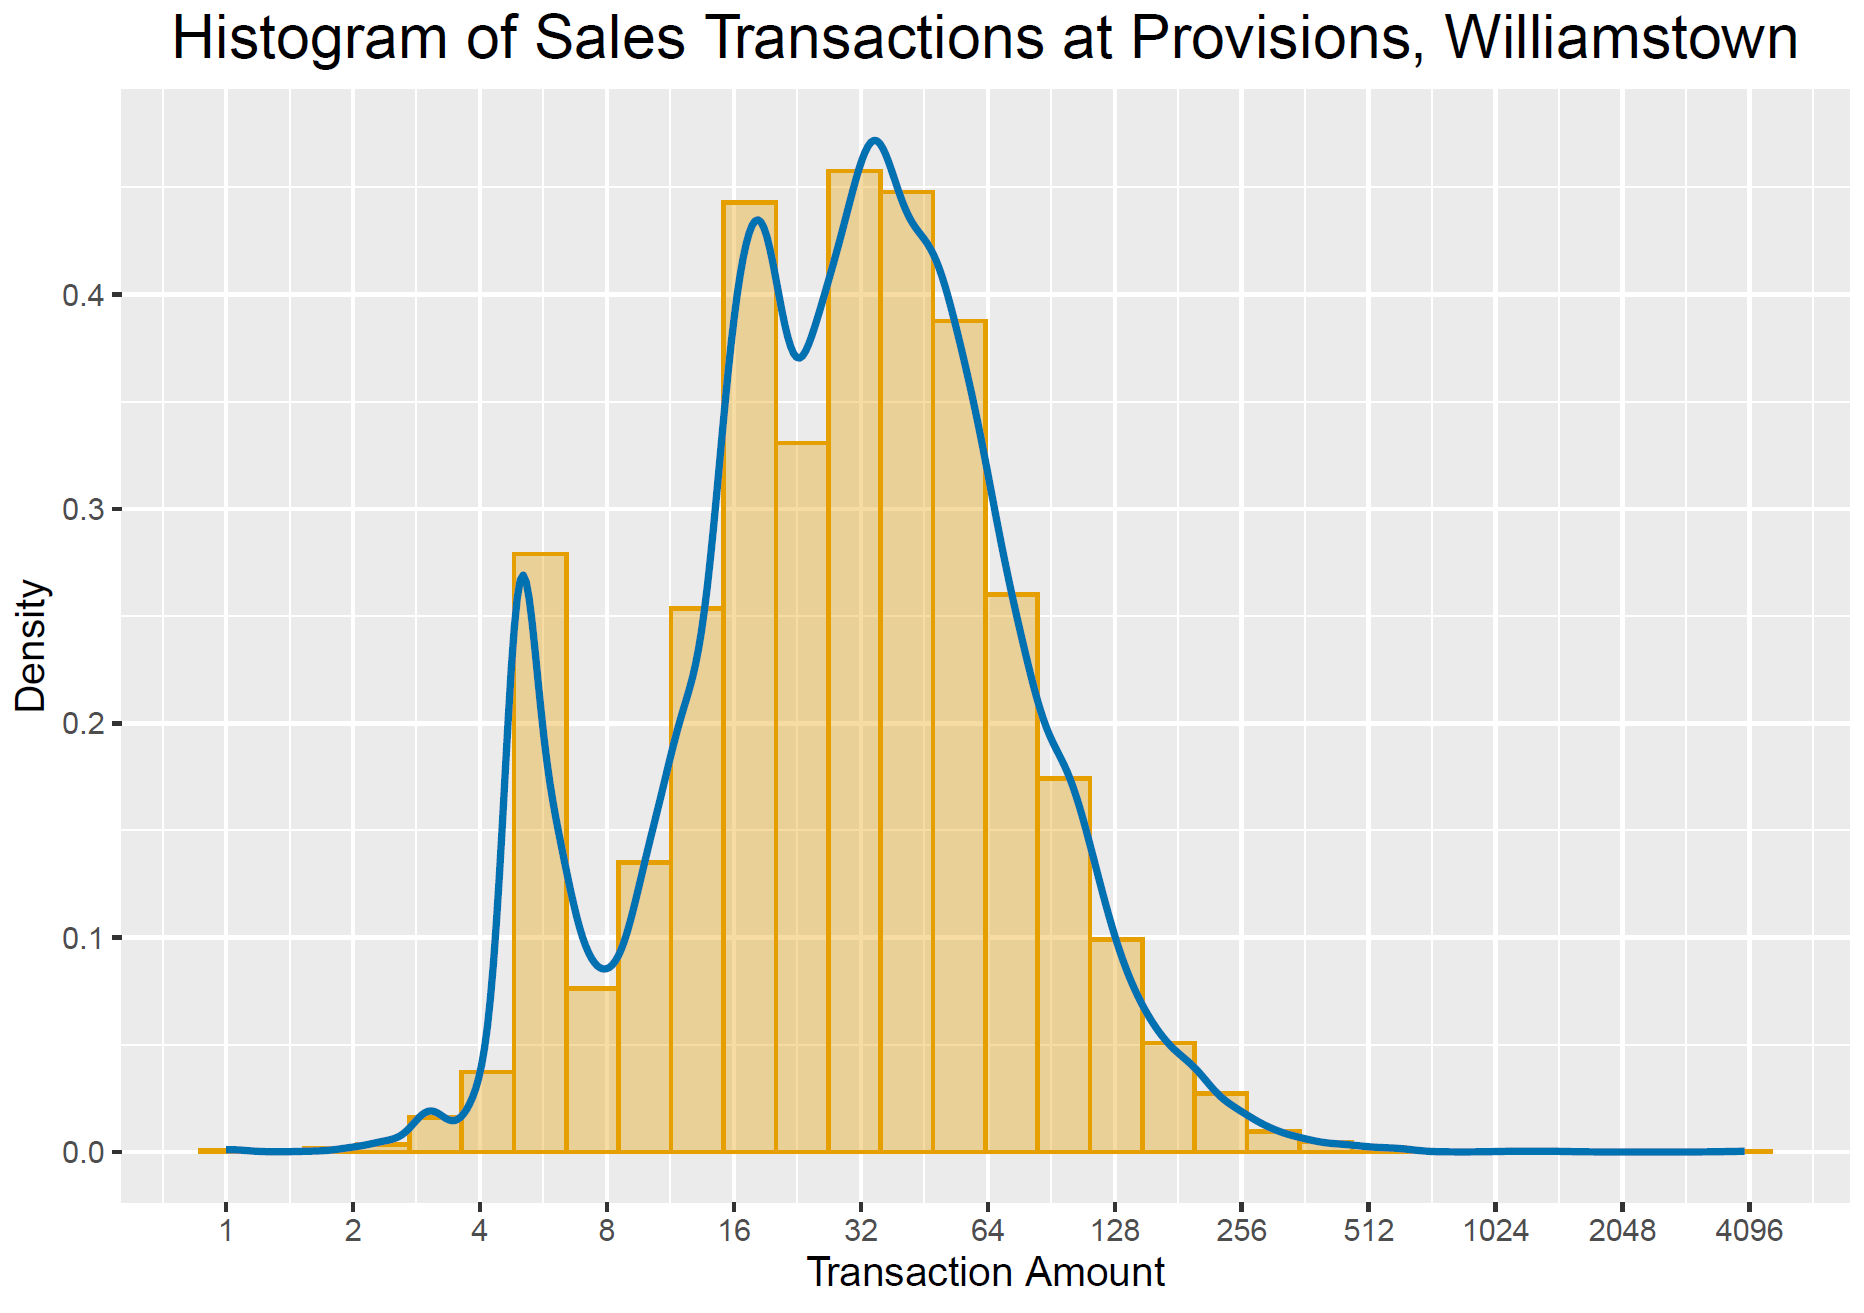
When you finish the lab, you can upload it here.