
Empirical Exercise 7, Part 1
This is the first of two exercises on difference-in-differences estimation using two-way fixed effects (TWFE). In this exercise, we’ll deepen our understanding of the mechanics of TWFE through a simple simulation exercise. We’ll create a small data set containing two units that are observed over four periods, and we’ll calculate the TWFE estimator of a treatment effect of interest using both Excel and Stata.
Two-Way Fixed Effects in Excel
We are going to create a data set that has the following structure:
| Unit | Period 1 | Period 2 | Period 3 | Period 4 |
|---|---|---|---|---|
| 1 | 0 | 1 | 1 | 1 |
| 2 | 0 | 0 | 0 | 1 |
We observe each of two units in each of four time periods. Unit 1 is treated in periods 2, 3, and 3, while Unit 2 is only treated in the last period. Hence, this data set is identical to the one describe in lecture.
However, instead of organizing this data in wide form, as above, we’re going to organize the data in long form so that every unit x time period is an individual obesrvation. So, our data set will look like this:
| Unit | Period | Treatment |
|---|---|---|
| 1 | 1 | 0 |
| 1 | 2 | 1 |
| 1 | 3 | 1 |
| 1 | 4 | 1 |
| 2 | 1 | 0 |
| 2 | 2 | 0 |
| 2 | 3 | 0 |
| 2 | 4 | 1 |
Open Excel or google sheets (or your favorite equivalent) and create a spreadsheet that looks like this, with 8 rows containing information on the treatment status of two units over four time periods. Now, add a column for your Y (ie dependent) variable, but leave it blank for now.
Now add three more columns that you call D Mean, D Mean t, and D Mean i. In the first of these columns,
have Excel calculate the mean of D (aka Treatment). To do this, start by selecting cell E2 (in the row
for Unit 1 and the D Mean column):
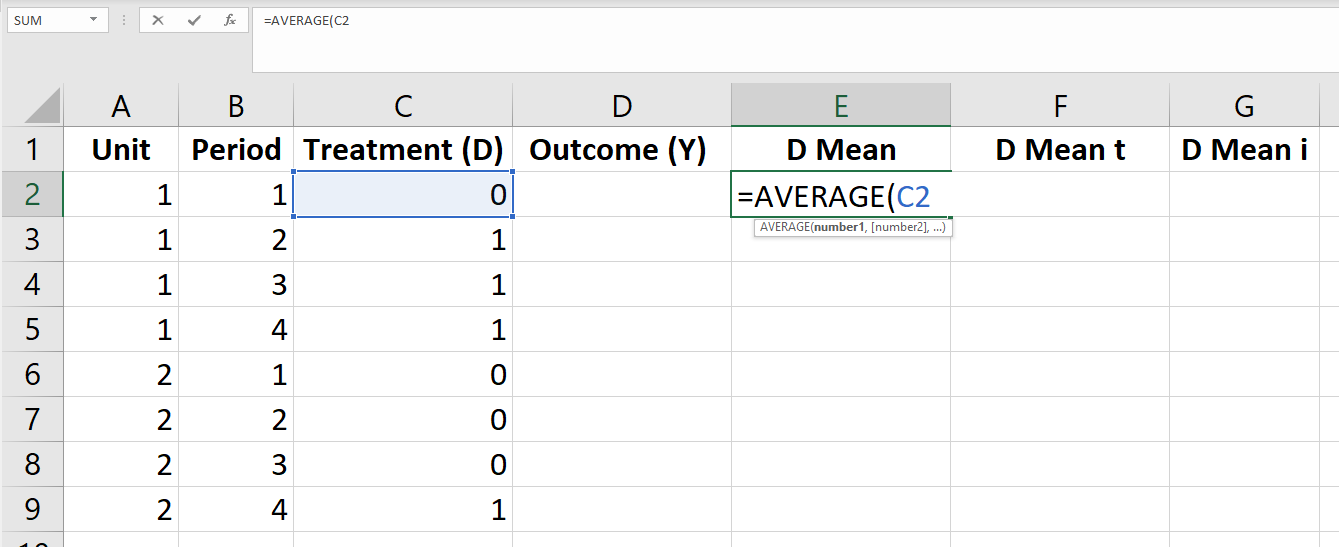
Enter the following formula into that cell: =AVERAGE(C$2:C$9). The dollar signs tell
Excel that, if you copy and paste the formula into another cell, it shouldn’t adjust the
cell numbers in relation to the cell where you are pasting the formula. Hit enter once
you’ve typed in the formula, and you should see that the text is replaced with the
value Excel calculated using the formula you entered. You should see that the cell now
says 0.5. Now copy and paste your formula into the other seven rows of your table in the
D Mean column.
Next, you need to figure out how to calculate the unit-specific and period-specific means of the treatment variable. Go ahead and do this.
Now create a column that you call D tilde (as in the lecture slides) or D residual (because
it is the residual of the treatment dummy D after regressing it on unit and time fixed effects). The
formula for this column should be Treatment - D Mean t - D Mean i + D Mean. Have excel
calculate this value for every observation (ie row). What is the sum of all the values of this new variable?
Now create two more columns/variables: the square of your D tilde values, and then your D tilde values
divided by the sum of all the squared terms. You’ve just calculated the weights in a two-way fixed effects regression
of Y on your treatment dummy. Which observations will receive negative weight in your regression calculation
of the treatment effect?
Now let’s run a regression. Enter Y values into the relevant column. Set the value of Y to zero for all
untreated observations, and pick a single value of Y for the treated observations. Create one last
column - Y x Weight - that is the value of the outcome variable multiplied by our calculated regression
weights. Calculate this for each observation, and then sum this up.
If you have done everything correctly, you should see that the estimated “regression coefficient” (the sum
of the values in the Y x Weight column) is the same as your “treatment effect” (the value of the outcome
variable in the treatment group, since the mean value of the outcome in the comparison group is 0). Now
try increasing all the vlaues of Y by 5. What happens to the estimated regression coefficient?
We know that two-way fixed effects can be biased when treatment effects change over time within treated units,
particularly when the impacts of treatment grow or shrink substantially over time. To see this happen, increase
the value of Y for Unit i in Period 4. Increase it to a very large number. Note that, in essense, this means
that the average impact of treatment is even larger. What happens to your estimated regression coefficient?
Two-Way Fixed Effects in Stata
Now let’s confirm that our results line up with two-way fixed effects in Stata. Create a do file containing the following code:
** generate a mini data set
clear
set seed 54321
set obs 8
gen id = 1 in 1/4
replace id = 2 in 5/8
gen time = mod(_n,4) + 1
sort id time

** create a treatment variable
gen d = 0
replace d = 1 if id==1 & t!=1
replace d = 1 if id==2 & t==4

** create an outcome variable
gen y = 4*d // homogeneous treatment effect
*replace y = 100 if id==1 & t==4 // effects increase

** add a bit of noise
replace y = y+0.01*rnormal()

** two-way fixed effects
reg y i.id i.time d
The code simulates a (tiny) data set similar to our Excel spreadsheet - the only difference is that we’ve added a bit of noise (ie a random error term) to the outcome variable. Read over the do file and make sure that you understand every line (looking up the help files for any unfamilair commands). What is the average treatment effect in this simulated data set? How does that compare to the estimated treatment effect in the two-way fixed effects regression?
Empirical Exercise
Extend your do file to answer the following questions:
- What is the t-statistic on the variable
din the two-way fixed effects regression ofyond? - Now modify your code so that
y = y+20for Unit 1 in Period 4. What is the (new) mean ofyin the treatment group? This is the true value of the average treatment effect. - Now run the two-way fixed effects regression of
yondcontrolling for unit and time period fixed effects. What is the estimated coefficient ond? - Reduce the value of
yby 20 ifid==1 & time==4(so that it is back to its original value), and then increase the value ofyby 20 for Unit 2 in Period 4. Confirm that the average value ofyin the treatment group (ie the average treatment effect) is unchanged. Run your two-way fixed effects regression again. What is the estimated coefficient ond? - Now regress
d, the treatment dummy, on unit and time fixed effects. After running your regression, use the post-estimation commandpredict d_resid, residto save the residuals from this regression in a new variable. What is the mean ofd_resid? - What is the value of
d_residifid==1 & time==4? - What is the value of
d_residin the other treated observations? - What is the minimum value of
d_residin the comparison group (ie whend==0)?